NSERC Open Data Exploration
NSERC Open Data Exploration
The 2018 federal budget of Canada 🇨🇦 announced significant new investments in research. The Canada Research Coordinating Committee is defining a work plan to promote "international and risky research; support for Canada's next generation of researchers; equity, diversity and inclusion; and indigenous research and capacity building".
This site explores the NSERC Awards Data with the goal of helping Canada to achieve the best outcomes for research and training of future researchers. Open analysis of research investments also helps advance the goals outlined in the Mandate Letter to the Minister of Science.
Canada's Open Government Portal includes NSERC Awards Data from 1995 through 2016. The awards data (in .csv format) were copied to an Amazon Web Services S3 bucket and analyzed using computing resources from PIMS on cloud infrastructure from Compute Canada and Cybera.
TODO Set up similar analyses for SSHRC
TODO Set up similar analysis for CIHR
You are invited to collaborate on the analysis of investments made by NSERC. Access to the data and source code are shared in a public repository on GitHub.
|
|
Overview
NSERC Budget
Interactive Notebook: Exploring NSERC
| Year | Total | Not Discovery | Discovery |
|---|---|---|---|
| 1995 | 451159747 | 267113329 | 184046418 |
| 1996 | 434116337 | 247533171 | 186583166 |
| 1997 | 417146970 | 227810152 | 189336818 |
| 1998 | 477141539 | 266731883 | 210409656 |
| 1999 | 526133116 | 299956302 | 226176814 |
| 2000 | 537934451 | 294508093 | 243426358 |
| 2001 | 554698568 | 316537927 | 238160641 |
| 2002 | 615320903 | 357333281 | 257987622 |
| 2003 | 696997644 | 423803197 | 273194447 |
| 2004 | 765643760 | 488699482 | 276944278 |
| 2005 | 820640167 | 519567082 | 301073085 |
| 2006 | 854567999 | 545233090 | 309334909 |
| 2007 | 968713281 | 655321429 | 313391852 |
| 2008 | 980889930 | 664642572 | 316247358 |
| 2009 | 1003483757 | 680426976 | 323056781 |
| 2010 | 1026366682 | 702101715 | 324264967 |
| 2011 | 1035205511 | 705872398 | 329333113 |
| 2012 | 1021894152 | 685991741 | 335902411 |
| 2013 | 1018139165 | 681486392 | 336652773 |
| 2014 | 1038149414 | 698064881 | 340084533 |
| 2015 | 1068044894 | 727279990 | 340764904 |
| 2016 | 1142066427 | 791496311 | 350570116 |
Accumulated Program Investments [1995 - 2016] Top 25
https://wwejubwfy.s3.amazonaws.com/Explore-NSERC-Open-Data_2018-04-18_21-42-14.png
Accumulated Principal Investigator Investments [1995-2016] Top 25
| ProgramNameEN | Reported Dollars |
|---|---|
| Discovery Grants Program - Individual | 5949789135 |
| Canada Research Chairs | 1590512911 |
| Collaborative Research and Development Grants | 948122955 |
| Strategic Projects - Group | 908959760 |
| Networks of Centres of Excellence | 762559105 |
| Research Tools and Instruments - Category 1 (<$150,000) | 565583275 |
| Postgraduate Scholarships | 435601321 |
| Industrial Research Chairs | 398835692 |
| Research Networks | 382614308 |
| Alexander Graham Bell Canada Graduate Scholarships - Doctoral | 352888065 |
| Postgraduate Scholarships - Doctoral | 340062867 |
| Postdoctoral Fellowships | 283101969 |
| Subatomic Physics Envelope - Project | 267988202 |
| University Undergraduate Student Research Awards | 258863102 |
| Major Resources Support Program - Infrastructure | 201128769 |
| Centres of Excellence for Commercialization and Research - Group | 186214812 |
| Engage Grants Program | 185938402 |
| Alexander Graham Bell Canada Graduate Scholarships - Master's | 175254486 |
| Cooperative Activities | 163228194 |
| College and Community Innovation Program | 161161262 |
| Major Facilities Access Grants | 159523772 |
| Collaborative Research and Training Experience | 147907095 |
| Canada Excellence Research Chairs | 137314666 |
| Discovery Grants Program - Accelerator Supplements | 121369119 |
| Postgraduate Scholarships - Master's | 114880771 |
TODO NSERC's Open Data does not report gender of PIs. Find ways to measure equity, diversity, inclusion metrics over past investments.
TODO How can we connect the reported dollar investments to measurements of research output?
Discovery
| Name | Reported Dollars | |------------------------+------------------| | Hormes , Josef | 99836800 | | Gupta , Arvind | 97587570 | | McWalter , Ian | 75503588 | | Fortier , Louis | 72542772 | | Frise , Peter | 63874923 | | Barge , Brian | 50400000 | | Thomlinson , William | 46610800 | | Fedosejevs , Robert | 40720798 | | McDonald , Arthur | 36781300 | | Orr , Robert | 32043881 | | Smith , Donald | 31227906 | | Mufti , Aftab | 28761712 | | Wallace , Douglas | 28433833 | | Servos , Mark | 28130452 | | Rogers , Harry | 27590000 | | Salama , Andre | 26296562 | | Burton , Howard | 25000000 | | Yada , Rickey | 24982617 | | Clowes , Ronald | 24072844 | | Pelton , Robert | 23985763 | | Svensson , Carl | 22782441 | | Lamb , Robert | 21349800 | | Chrisman , Nicholas | 21286250 | | Larter , Stephen | 20024564 | | Bourbonnais , Normand | 17753965 | |------------------------+------------------|
Evaluation Groups
Interactive Notebook: Evaluation Groups Analysis
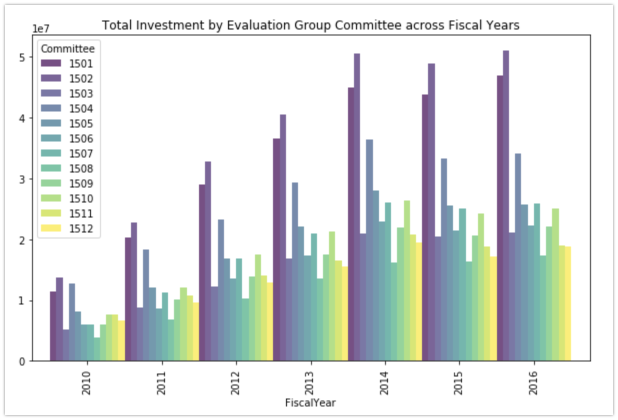
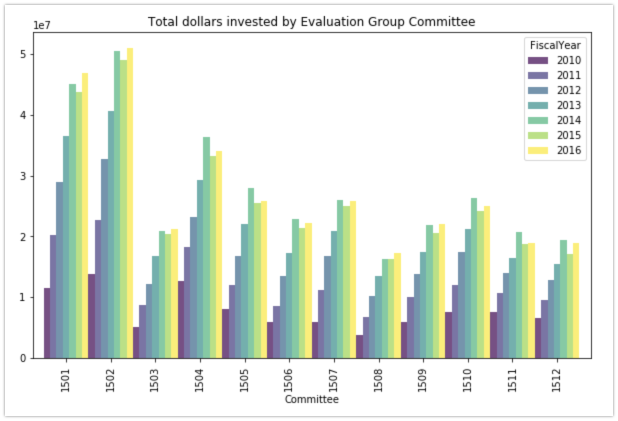
Award Amounts
https://wwejubwfy.s3.amazonaws.com/EvaluationGroups-Analysis_2018-04-18_22-14-20.png
https://wwejubwfy.s3.amazonaws.com/EvaluationGroups-Analysis_2018-04-18_22-18-00.png
TODO Why do 1501 and 1502 receive so much more investment than other EGs?
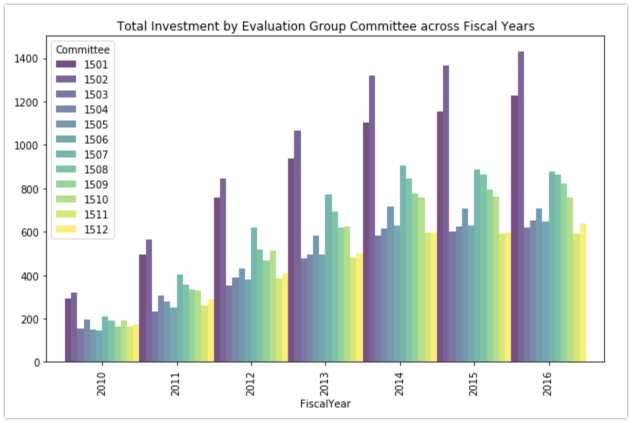
Number of Awards
https://wwejubwfy.s3.amazonaws.com/EvaluationGroups-Analysis_2018-04-18_22-18-48.png
TODO Why are there so many more awards in 1501 and 1502 than in other EGs?
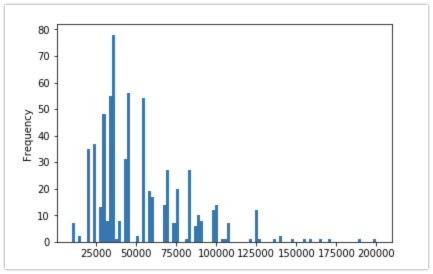
Bin Frequency
https://wwejubwfy.s3.amazonaws.com/EvaluationGroups-Analysis_2018-04-18_22-20-01.png
Example: 1504 (Chemistry); FiscalYear 2013
TODO Find a way to infer bin levels based on awards data amounts
Engage
https://wwejubwfy.s3.amazonaws.com/EvaluationGroups-Analysis_2018-04-18_22-26-14.png
Interactive Notebook: Engage Grants
TODO Find a way to connect Engage Grant investments to economic impact metrics.
CRC
CRD
1508
https://wwejubwfy.s3.amazonaws.com/EngageGrantsSummary_2018-04-19_09-05-52.png
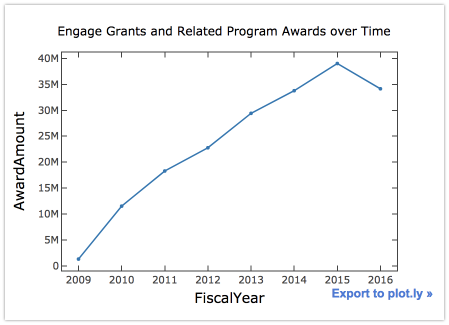
The Long Range Plan arranged for the math/stats envelope to have \( \frac{CTRMS}{1508 + CTRMS} = 0.19 \) during 2014-2019. NSERC's Open Data shows a discrepancy of more than $1MM.
| Year | 1508 | CTRMS | Total | CTRMS/1508 | Discrepancy | Funding Gap |
|---|---|---|---|---|---|---|
| 2014 | 16235610 | 2656500 | 18892110 | 0.14061426 | 0.04938574 | 933000.83 |
| 2015 | 16354650 | 3531500 | 19886150 | 0.17758591 | 0.01241409 | 246868.46 |
| 2016 | 17231868 | 4212500 | 21444368 | 0.19643852 | -6.43852e-3 | -138069.99 |
| 1041799.3 |